Grouping
Barchart automatically groups data by date, depending on zoom, but you can specify a nodeGroupIdFunction and/or edgeGroupIdFunction to make it group together nodes with different data. Let's say you have two types of nodes: persons and cars, like this:
GroupIdFunction
const ogma = new Ogma({
  container: "ogma",
  graph: {
    nodes: [
      ...new Array(8).fill(0).map((_, id) => ({
        id,
        data: { type: "car", start: new Date(`1 1 ${1950 + id}`) },
      })),
      ...new Array(8).fill(0).map((_, id) => ({
        id: 8 + id,
        data: { type: "person", start: new Date(`1 6 ${1950 + id}`) },
      })),
    ],
    edges: [],
  },
});
By default, the timeline will render all nodes without distinction. You can split different types of nodes by passing nodeGroupIdFunction and/or edgeGroupIdFunction to the timeline:
You can then pass a nodeGroupIdFunction that will create bars for cars and bars for persons.
const timelinePlugin = new TimelinePlugin(ogma, container, {
  barchart: {
    nodeGroupIdFunction: (node) => node.getData('type'),
    edgeGroupIdFunction: (edge) => edge.getData('type'),
  },
  timeline: {
    nodeGroupIdFunction: (node) => node.getData('type'),
    edgeGroupIdFunction: (edge) => edge.getData('type'),
  }
});
ItemGenerator
By default the timeline will set Node-${id} as labels for each element. But you might want to display different names, you can do that with nodeItemGenerator and edgeItemGenerator function:
timeline: {
nodeItemGenerator: (node) => {
return {
content: `${node.getData("type")} ${node.getId()}`
};
},
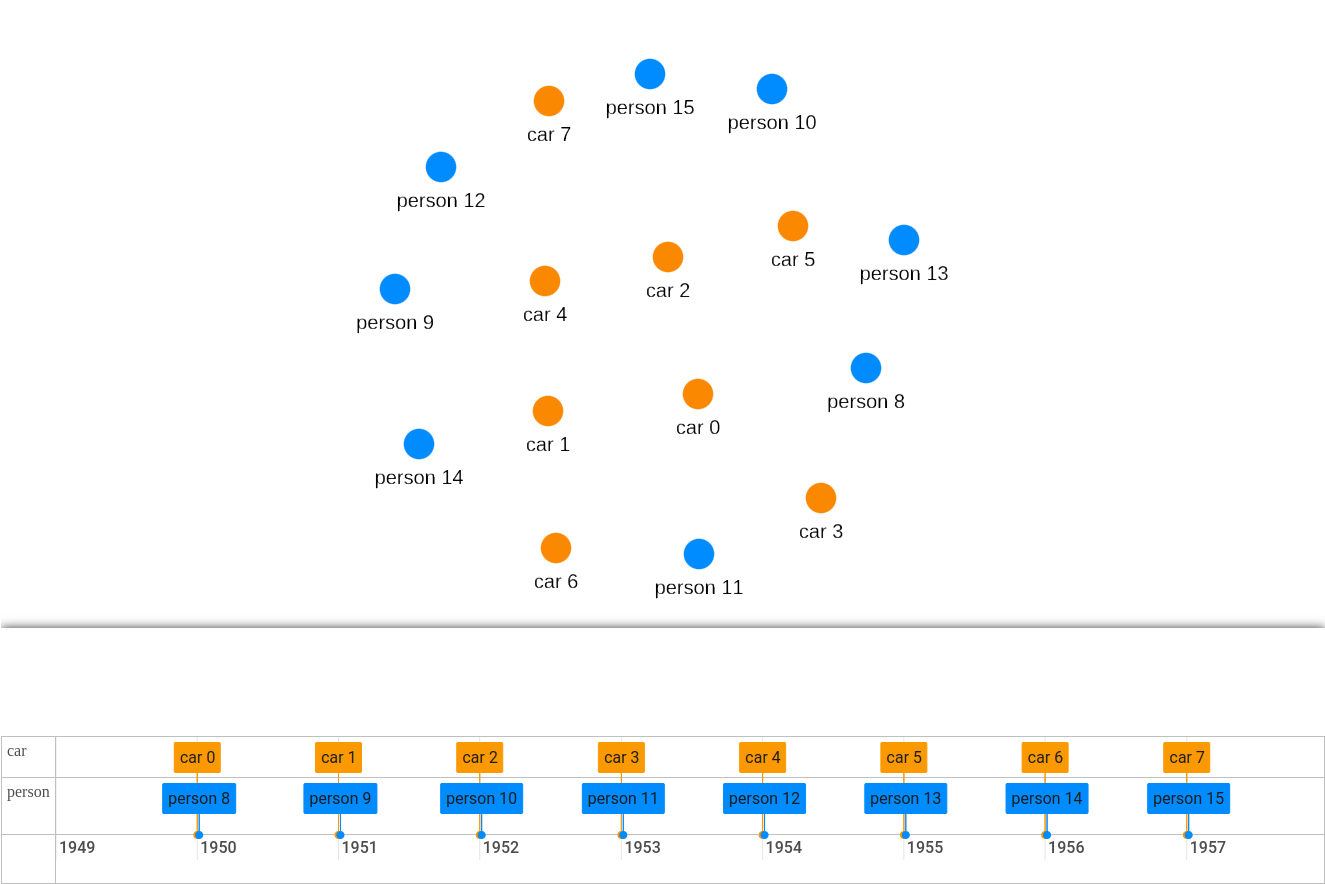
},Now with both itemGenerator and nodeGroupIdFunction, your timeline shows one row for each node type and proper labels. Items within a group will have a class corresponding to the groupId return by nodeGroupIdFunction. You can use it to style your items. See styling
Result